GM Energy Executive Intelligence Platform
Transforming Fragmented Digital Analytics into an AI-Powered Decision Ecosystem
Timeline:
5 months
Team:
20+ person agency team (spanning art directors, strategists, UI designers, and account directors)
My Role:
UX Lead

Executive Overview
GM Energy had access to vast amounts of digital analytics, but executive leadership still struggled to answer a fundamental question: "Why are customers behaving this way, and what should we do next?"
Traditional analytics dashboards reported historical metrics in isolation. They rarely connected customer behavior across fragmented channels or translated raw data into strategic business decisions.
We reframed the core initiative from a routine dashboard redesign into a strategic product vision: building a modern, AI-powered business decision platform that unites commercial KPIs with user experience friction to drive confident executive action.

The Challenge
Existing reporting within GM Energy suffered from structural friction that slowed down strategic decision-making:
Siloed Data Architecture: Digital analytics, marketing performance, and operational sales metrics existed across disconnected sources.
Context & Prioritization Gap: Data reported what happened, but lacked the contextual framing needed to explain why.
Heavy Cognitive Load: Executive leadership spent valuable time manually interpreting reports and reconciling conflicting numbers between teams.
Separation of UX & Revenue: Behavioral friction (drop-offs, rage clicks, journey roadblocks) lived in UX research repositories, completely isolated from high-level business analytics.
Rather than arranging new charts on a canvas, I posed the core design question:
“How might we transform passive analytics into an active intelligence layer that directly supports executive decisions?”

My Strategic Contributions & Leadership
As the UX Lead, I drove the strategic direction, information architecture, and end-to-end design execution:
Product Strategy & Decision Framing: Shifted the analytics taxonomy from tool-based reporting sources to decision-oriented business questions.
UX Intelligence Strategy: Pioneered the integration of behavioral diagnostic metrics into executive reporting.
AI Copilot Experience Design: Conceptualized and designed an embedded AI assistant to reduce cognitive load and convert passive data views into natural language conversations.
Information Architecture & Dashboard Framework: Structured role-based dashboards, high-level summaries, and progressive drill-down workflows.
Executive Storytelling & Prototyping: Built high-fidelity interactive Figma prototypes and authored the executive pitch deck to align client leadership.

Discovery & Research
Before sketching layouts, I conducted discovery to understand how leadership actually evaluated performance.
Instead of asking stakeholders "What metrics should be on your dashboard?", I asked:
“What specific decisions are you trying to make each week, and where does your confidence stall?”

Discovery Activities & Insights
Analytics & Heuristic Audit: Evaluated legacy reporting suites to identify redundant views and visual noise.
Executive Use-Case Mapping: Mapped decision paths across marketing, product, and digital operations leads.
Competitive Analysis: Evaluated enterprise intelligence frameworks across SaaS and automotive platforms.
Key Research Insight: Executives rarely needed more data; they were suffering from data fatigue. They needed context, explanation, prioritization, and confidence.
Data Strategy: Grouping Around Business Intent
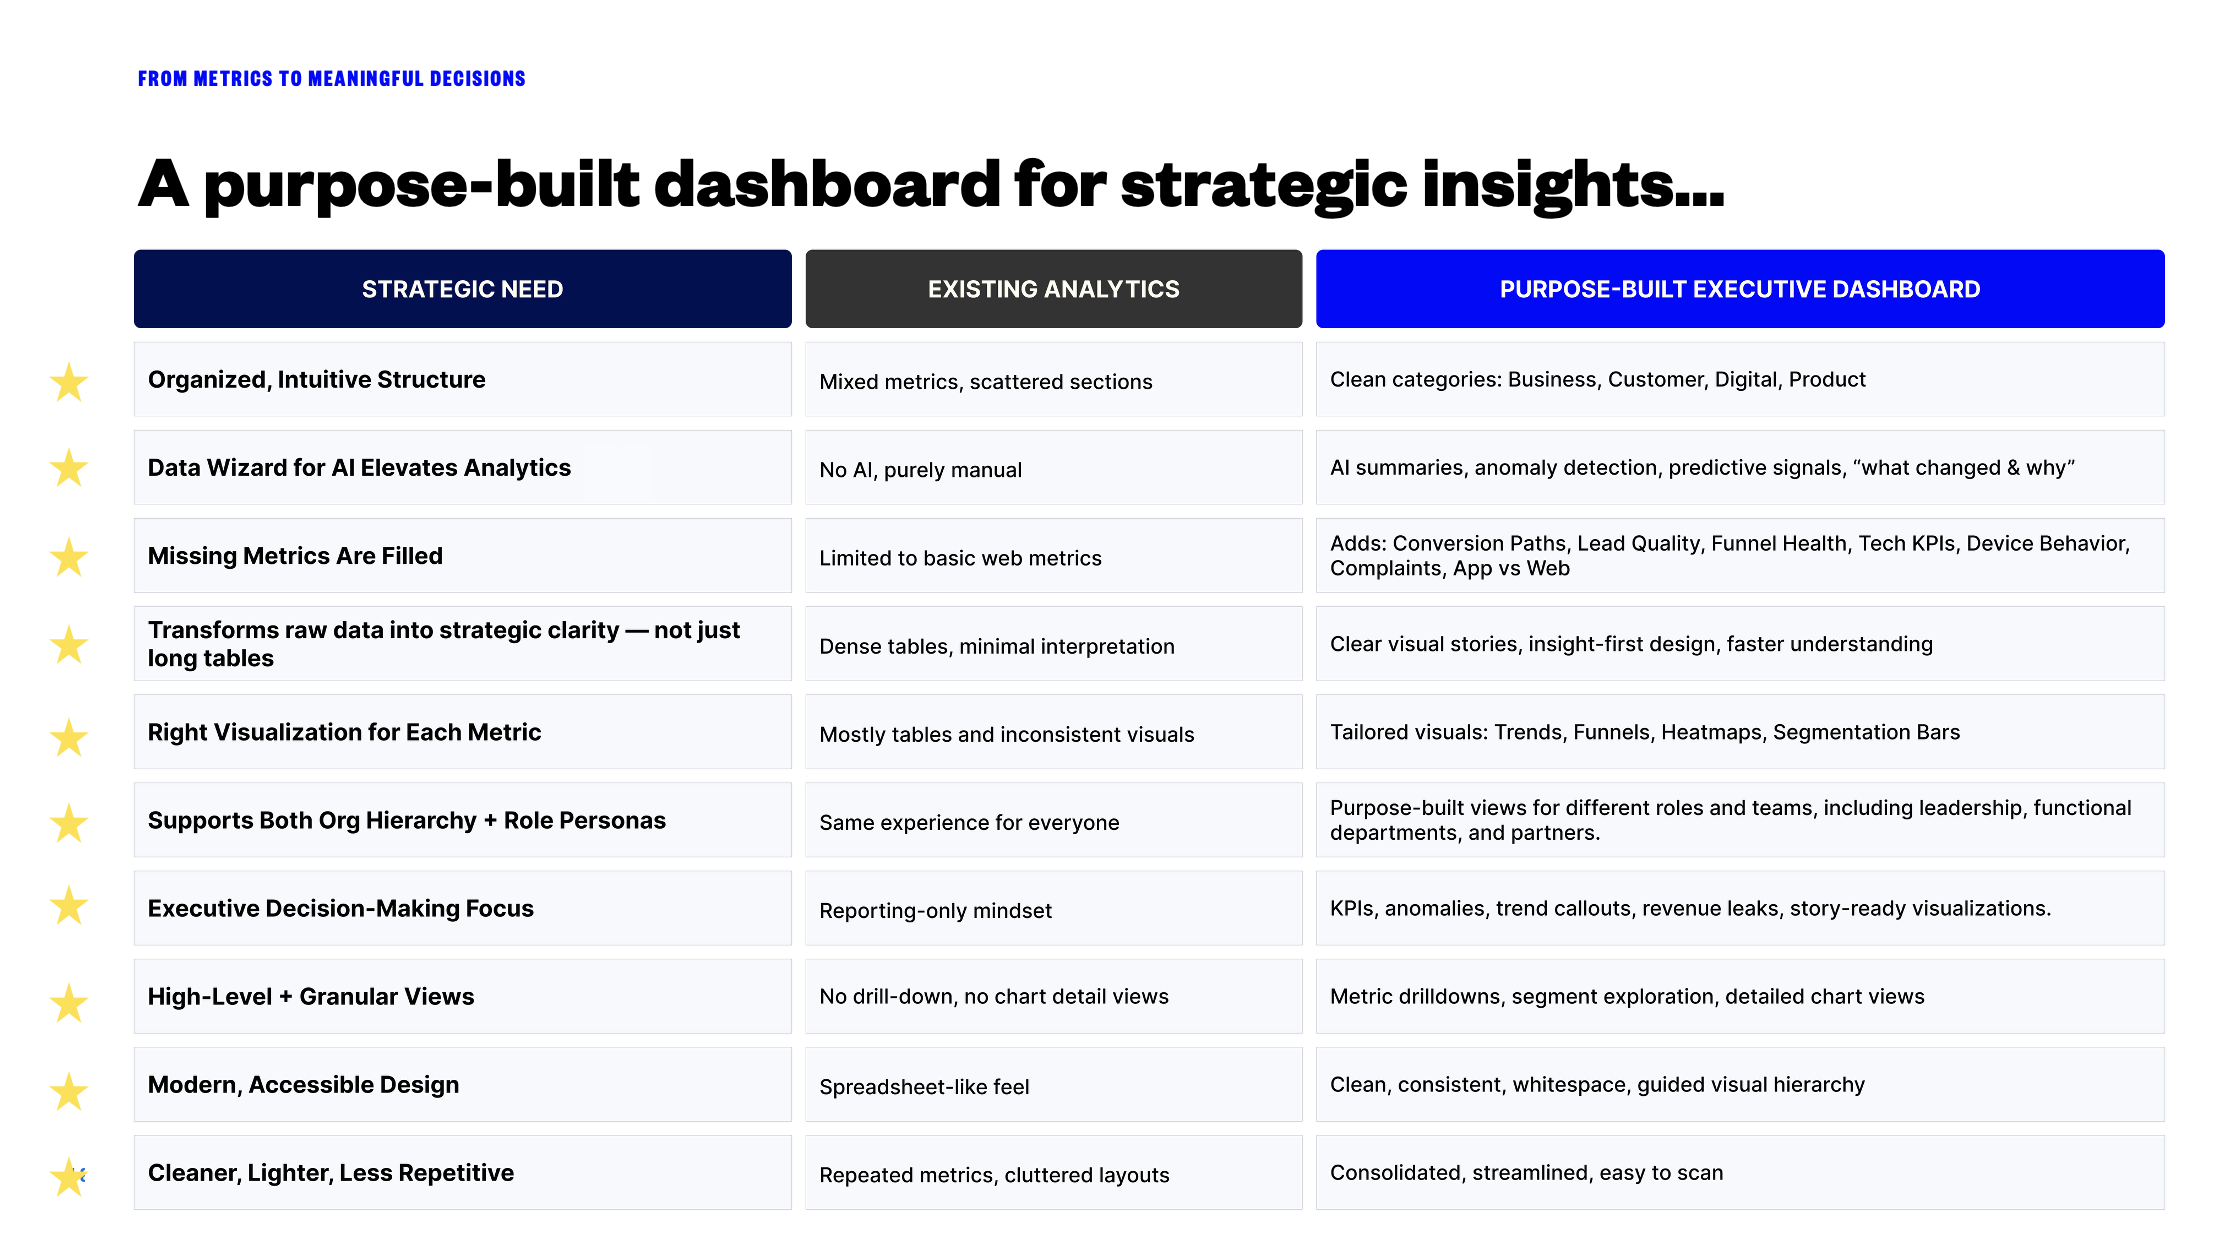
To organize hundreds of potential metrics without overwhelming users, I overhauled the information architecture. Instead of grouping metrics by data source (e.g., Website Analytics, Marketing Data, Sales CRM), I categorized them around core business questions:
Customer Insights: Intent, lifecycle stage, and cross-channel journeys.
Digital Performance: Conversion funnels, touchpoint efficiency, and channel health.
Product Performance: Feature usage, battery/charging ecosystem engagement, and vehicle integration.
Business Performance: Revenue drivers, acquisition costs, and strategic KPIs.
UX Intelligence: Behavioral friction, journey roadblocks, and customer sentiment.
This shift pivoted internal conversations from "What data do we have?" to "What business decision are we enabling?"
Introducing "UX Intelligence"
Traditional business dashboards ignore user experience quality until revenue drops. I intentionally embedded UX Intelligence alongside core financial indicators to establish a clear line of sight between usability and commercial outcomes.
Embedded UX Metrics Included:
Journey Friction Signals: Highlighting checkout abandonment, form retry rates, and rage-click hotspots.
Behavioral Diagnostics: Connecting scroll-depth and engagement drop-offs to specific page layouts.
Qualitative Sentiment & Tests: Surface-level integration of usability findings, A/B test results, and user research highlights directly next to revenue trends.
By elevating UX metrics to executive reviews, leadership could immediately trace a drop in conversions back to specific digital friction points.
Designing AI as a Strategic Design Partner
To turn static reporting into active intelligence, I designed an embedded AI Assistant directly within the platform. Rather than adding AI as a gimmick, every interaction was focused on accelerating comprehension.
Key AI Touchpoints & Interactions:
Natural Language Queries: Leaders could ask direct questions such as "Why did EV charger checkout conversions drop in the Northeast this month?" or "What are our top 3 drop-off points this week?"
Automated Anomaly Detection: Highlighted unexpected metric spikes or dips automatically, accompanied by a generated root-cause narrative.
Actionable Recommendations: Suggested concrete next steps based on historical patterns (e.g., "Recommend reviewing mobile payment step friction in region X").
The AI transformed executive reporting from a static, manual reading exercise into a proactive, conversational insights engine.
Human Strategy + AI-Accelerated Workflow
To execute this vision within an agile timeframe, I integrated AI tools into my personal design workflow:
Human Design Expertise: Led core product strategy, stakeholder alignment, information architecture, UX frameworks, and executive presentation design.
AI Acceleration: Utilized ChatGPT and Claude to rapidly synthesize qualitative interview notes, stress-test metric categorization taxonomies, and draft realistic microcopy for dashboard edge cases.
This hybrid approach eliminated administrative overhead, allowing me to dedicate maximum time to high-value strategic design and visual polish.
Final Prototype & Core Capabilities
The final deliverable was a high-fidelity, interactive Figma prototype structured around clear executive workflows:
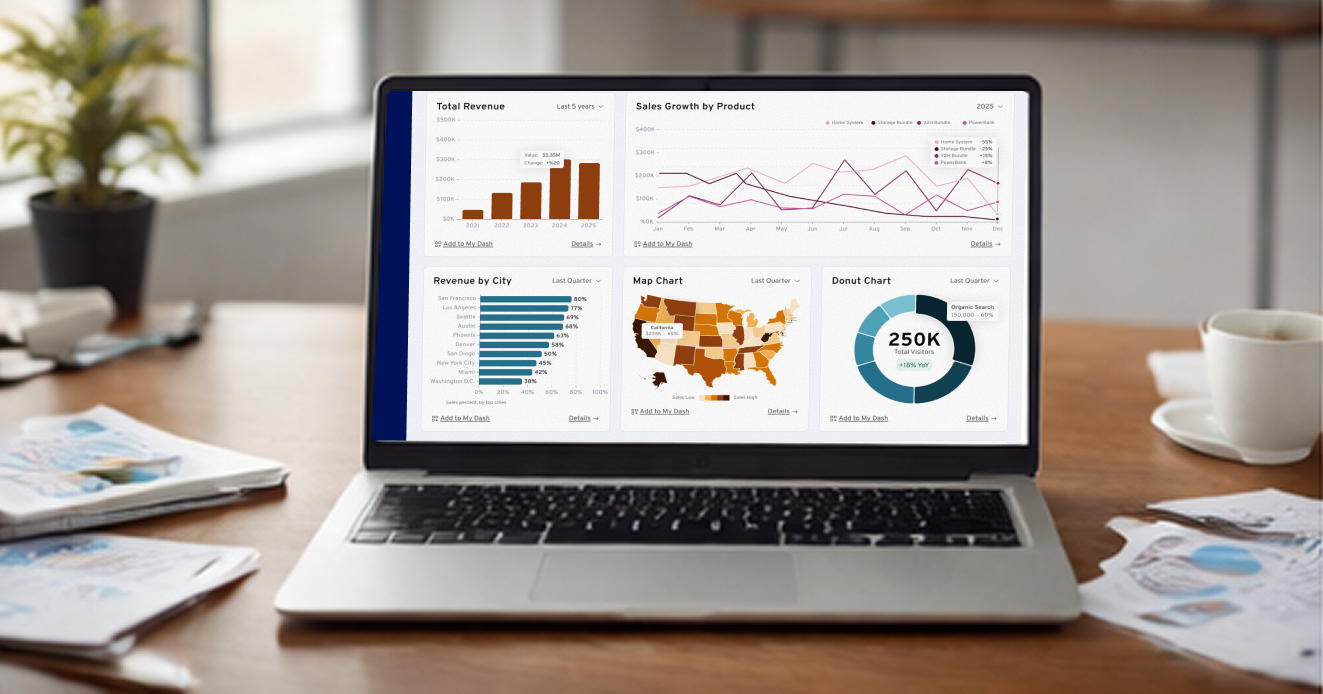
Executive Overview: High-level macro health indicators, key revenue drivers, and AI-generated weekly executive summaries.
Role-Based Views: Tailored dashboards customized for Digital Ops, Product Leads, and Marketing Strategy.
Embedded AI Copilot: Persistent conversational panel capable of contextual summaries, drill-down explanations, and trend forecasts.
UX Behavioral Diagnostics: Interactive heatmaps, friction scoring, and journey drop-off visualizations paired with financial impacts.
Progressive Drill-Down: Seamless transition from macro KPIs to granular, page-level performance data in two clicks.
Business Value & Strategic Impact
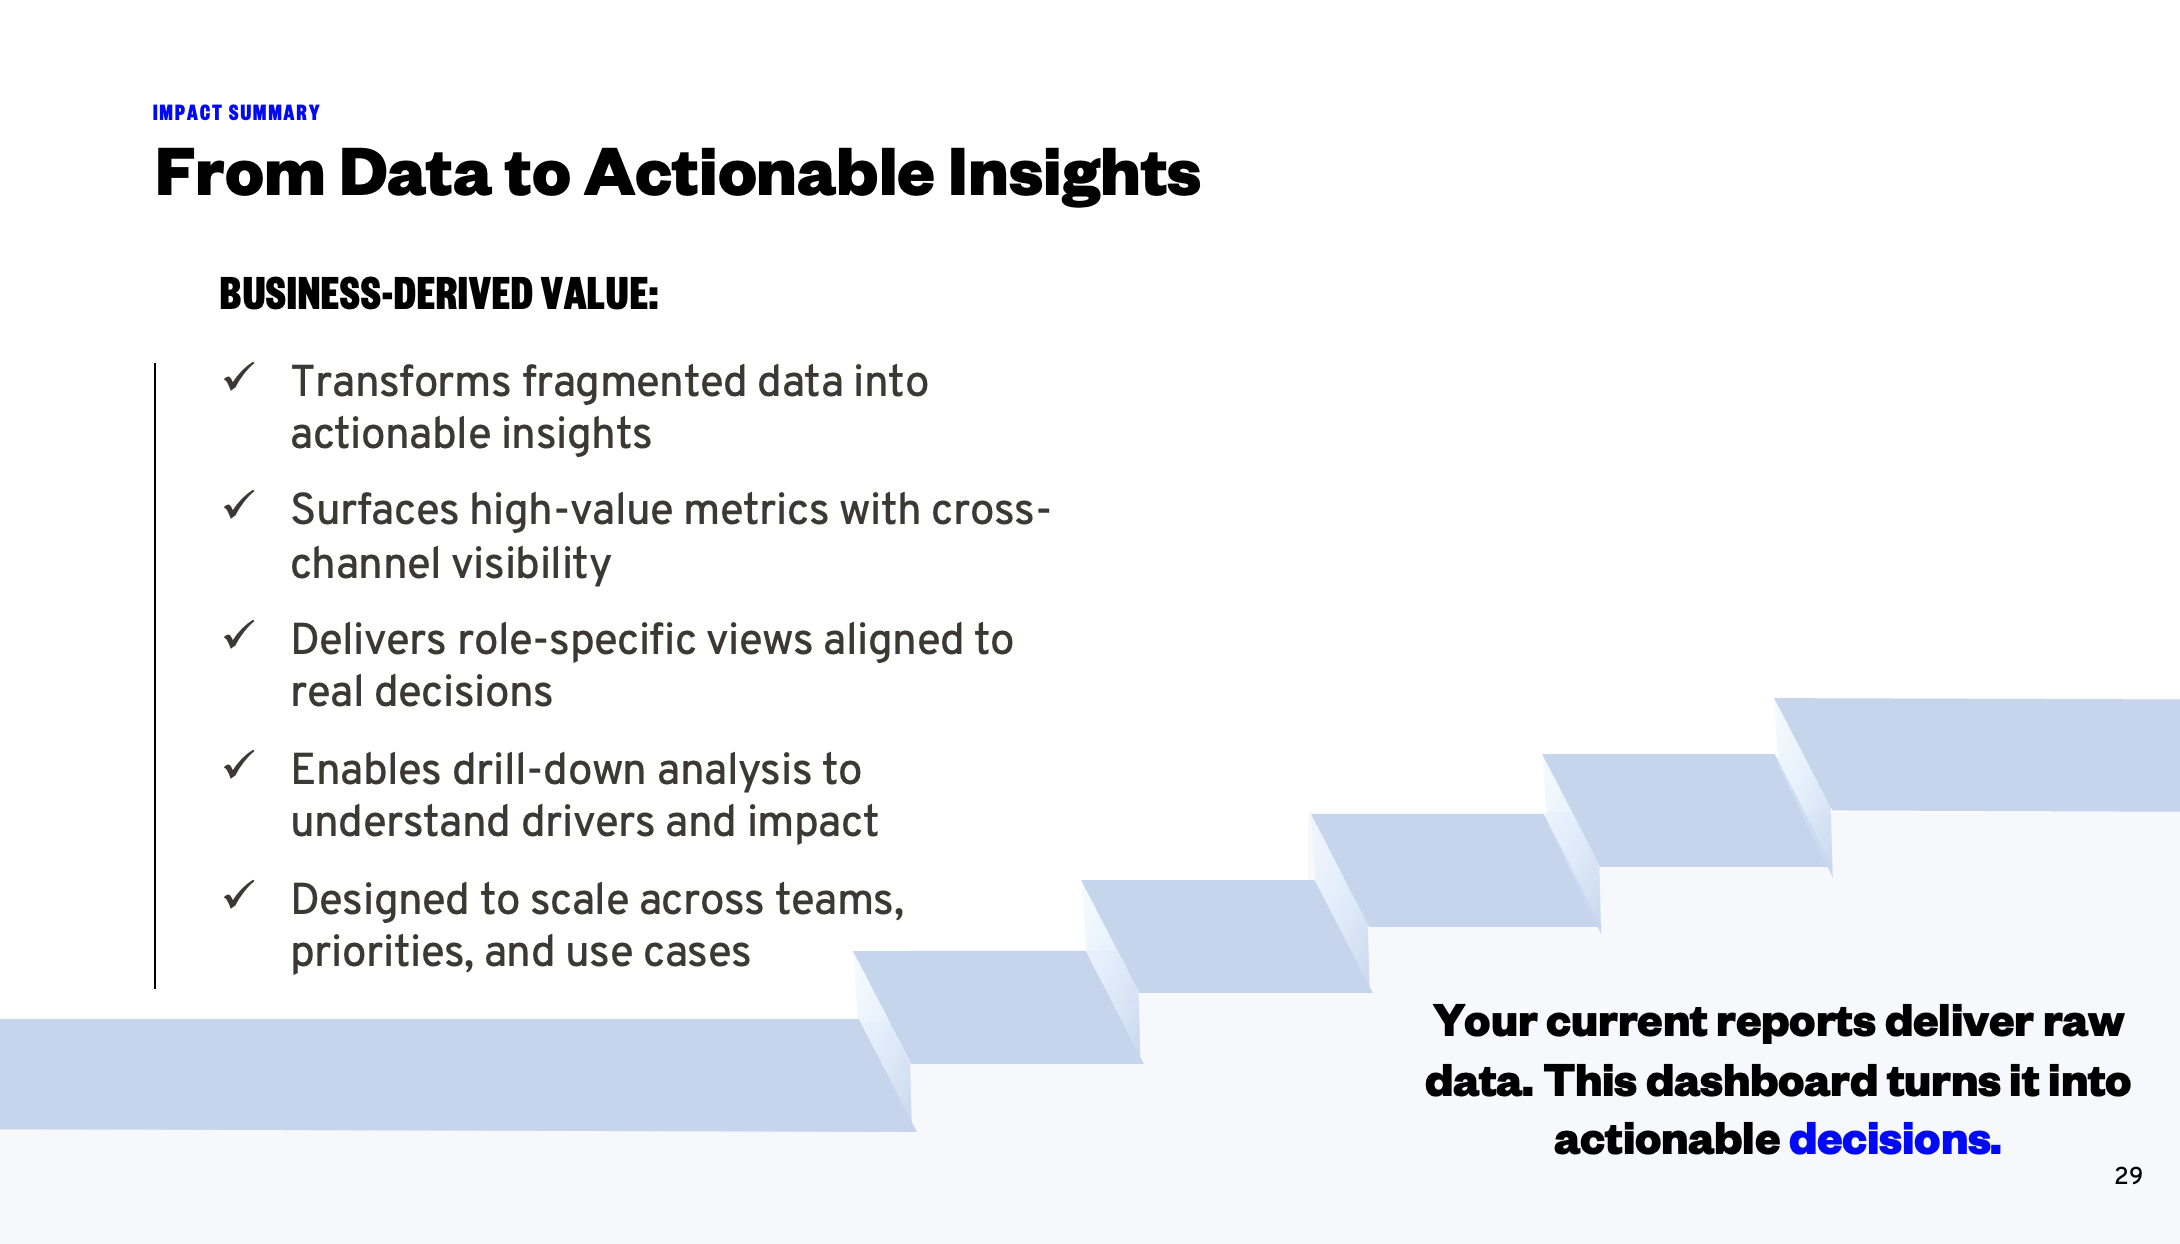
Unified Ecosystem: Consolidated fragmented analytics tools into a single, cohesive source of truth for GM Energy leadership.
Reduced Time-to-Insight: Streamlined executive review prep time by automating metric synthesis and root-cause analysis through AI.
Elevated UX Visibility: Formally integrated user experience health and journey friction into high-level business reviews.
Scalable Architecture: Built a modular dashboard framework and component design system capable of expanding as GM Energy's product line grows.
Key Reflection
Data alone doesn't create business value. Thoughtful UX design creates value by transforming data into understanding—and AI amplifies that value by making insights accessible, explainable, and actionable.
This project showcased how lead-level product design extends far beyond arranging charts on a grid. By bridging business strategy, data architecture, behavioral UX, and AI interaction design, I helped transform complex enterprise data into a clear, decisive roadmap for leadership.